Most SaaS marketing statistics floating around describe companies much bigger than yours.
A benchmark built from $50 million companies won’t tell a seed-stage founder much.
The numbers that actually matter from seed to Series A are acquisition cost, payback period, conversion rate, and retention rate.
Understanding how each channel performs makes it easier to prioritize your next marketing investment.
Quick Summary
- Most SaaS benchmarks favor SEO, email, referrals, and PLG (Product-Led Growth).
- CAC (Customer Acquisition Cost), payback, conversion, retention, and ROI (Return on Investment) guide decisions.
- Early-stage benchmarks need trend tracking, rather than one-month comparisons.
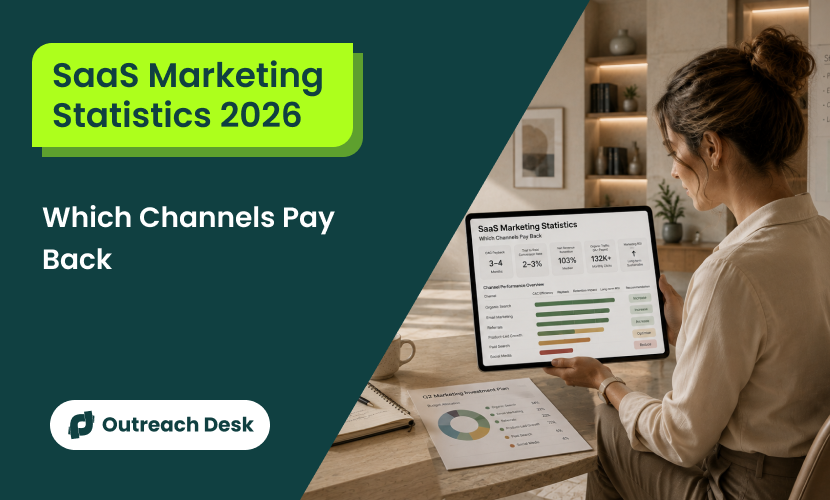
- NRR at 103% median, and 132,889 median monthly clicks for sites with 5,000+ indexed pages.
- AI search changes discovery, but quality still matters most.
Understanding SaaS Marketing Statistics and Their Value
Imagine two SaaS companies. Each company invests $15,000 a month in marketing.
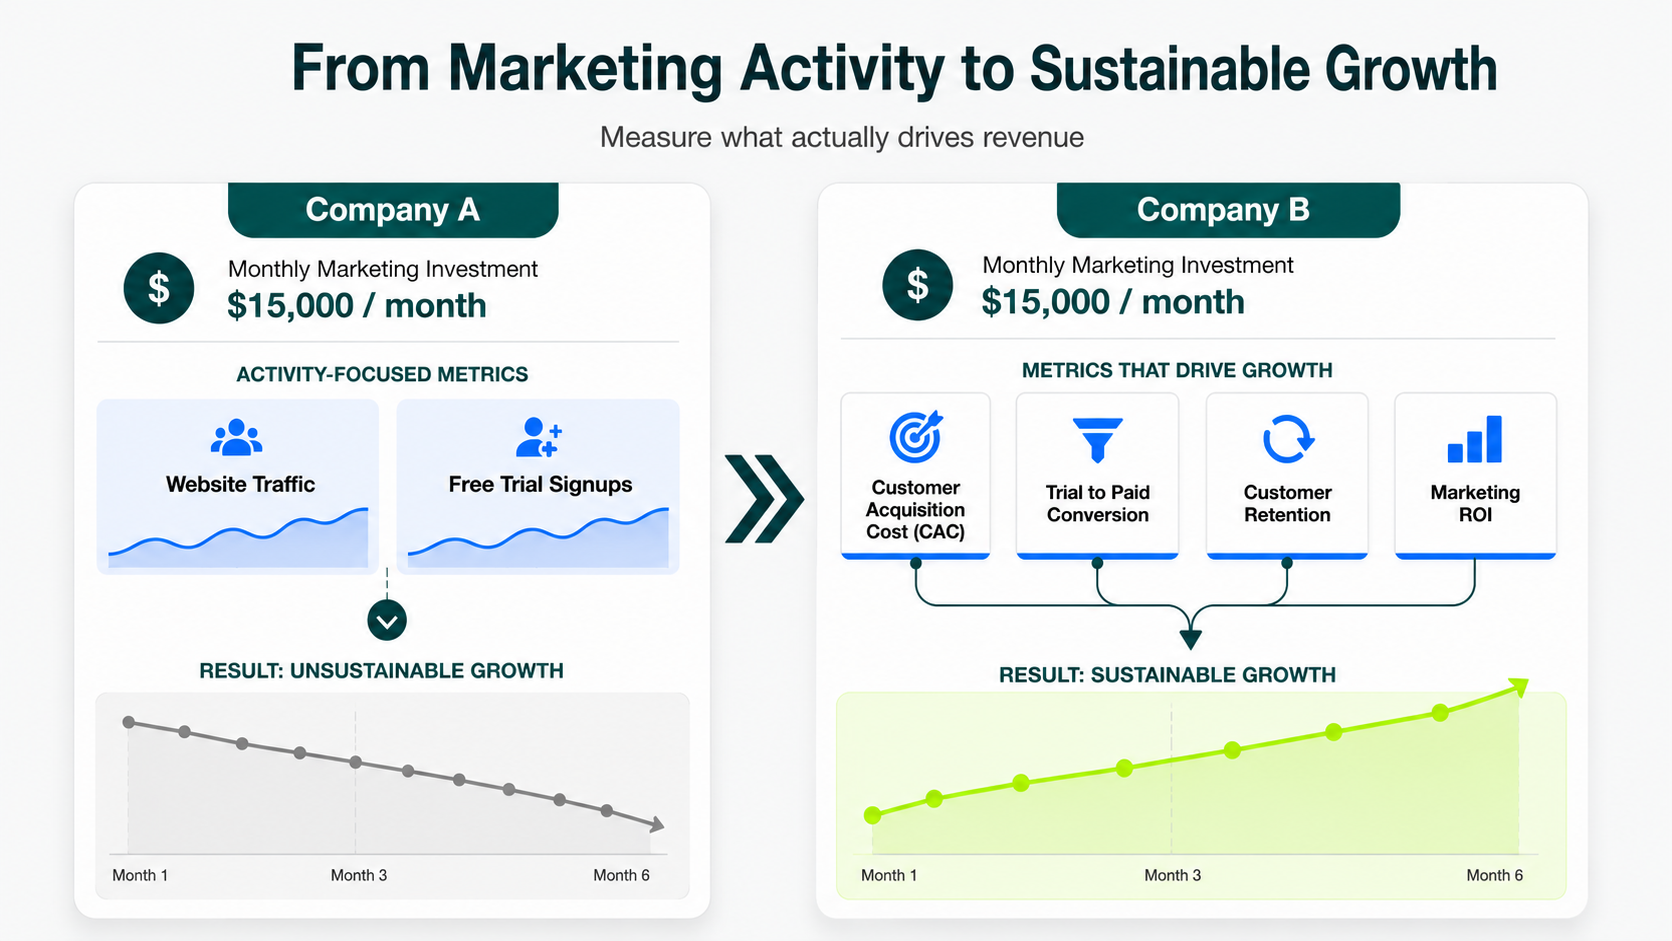
At first, both companies appear equally successful. Both attract thousands of website visitors, generate free trial signups, run Google Ads, promote their product on social media, and publish content regularly.
Six months later, one company is growing consistently while the other is struggling. Both have spent equally. Their results differ because one company understood the numbers behind its marketing more effectively.
Website traffic and signup counts tell only part of the story. SaaS marketing statistics show how effectively your marketing converts visitors into paying customers and how much it costs to acquire them.
They also show whether they continue generating recurring revenue over time.
What Are SaaS Marketing Statistics?
SaaS marketing statistics are the numbers that show how effectively your marketing attracts, converts, and retains customers.
Every stage of the customer journey generates data, from website visits and ad clicks to free trial signups, paid subscriptions, renewals, and cancellations.
On their own, these numbers each tell only part of the story. Together they reveal whether your marketing efforts are creating sustainable growth or simply generating activity.
Rather than relying on assumptions, SaaS businesses use these metrics to measure how each marketing channel contributes to revenue.
SaaS marketing considers these metrics:
- Customer Acquisition Cost (CAC)
- Trial to paid conversion rate
- Customer retention
- Marketing ROI
These factors help teams understand where growth comes from and where teams need improvements.
How do These Metrics Help Your Business?
These metrics allow you to make informed marketing decisions instead of relying on guesswork.
You can identify which acquisition channels deserve a larger budget and recognize which campaigns are no longer profitable. You can also improve conversion rates across the customer journey and reduce customer loss before it affects long-term growth.
These benchmarks also provide a way to compare your performance with other SaaS companies at a similar stage.
Rather than copying another company’s strategy, you can use industry statistics to evaluate your own results. They can also help you set realistic goals and identify the areas that will have the greatest impact on growth.
SaaS Marketing Statistics at a Glance
Here is the current data, what supports it, and where that support runs out.
| METRICS |
WHAT WE KNOW RIGHT NOW |
|---|---|
| Customer Acquisition Cost (CAC) |
It varies too widely across industries and channels for a single published number to mean much. (Track your own by channel.) |
| CAC Payback Period |
Benchmark against your own 3–4 month trend. Track how quickly you recover your customer acquisition costs, then compare trends as your campaigns mature. |
| Trial-to-paid Conversion |
Self-serve and sales-assisted convert at very different rates. (Compare your own number to your own motion, rather than a blended figure.) |
| Net Revenue Retention (NRR) |
103% median, 117.9% at the 90th percentile, for bootstrapped (self-funded) SaaS companies. (SaaS Capital) Venture-backed teams should treat that as a base. |
| Organic Traffic by Authority |
Sites with 5,000 or more indexed pages see a median of 132,889 monthly clicks, compared with 81,530 for top-authority-band sites alone (Ahrefs). |
| Marketing Spend as a Share of Revenue |
No fixed healthy ratio applies across every stage. Watch the trend rather than a single published number. |
| AI’s Effect on Buyer Research |
No special markup or writing style earns AI-answer placement, but buyers are starting their research there anyway. |
What These SaaS Benchmarks Describe
Most SaaS benchmarks come from companies that have already passed their first million in revenue. That’s not a flaw in the research.
Researchers study these companies because they have enough data and a marketing team that can share it.
The biggest gap we see is between the published benchmarks and what early-stage clients actually see.
Industry studies often reflect companies with established brands, larger content libraries, and ongoing marketing budgets. Newer businesses start with fewer assets, lower publishing frequency, and slower link acquisition.
The benchmarks are still useful, but they work best as reference points rather than targets that every young website should try to match immediately.
A number built from that population can still help you, as long as you read it correctly.
This is how to read a published median depending on where your company actually appears.
Companies raise money in stages, called funding rounds.
These stages include pre-seed or seed, Series A, Series B, and later stages.
- Pre-seed is an idea stage with no revenue. Seed is first outside money, testing fit.
- Series A means proven traction, so investors scale it up.
- Series B is fast growth, wider markets.
- Series C and beyond are big-scale, prepping for an IPO (each round trades equity for cash).
| YOUR STAGE |
HOW TO READ A PUBLISHED SAAS BENCHMARK |
|---|---|
| Pre-Seed or Seed |
Your results will probably be lower in the early stages, and that’s completely normal. |
| Series A |
Use it as a general guide; your results vary by industry and price point. |
| Series B and Later |
The published median is describing companies close to yours. Trust it more, and check it against your own peer group. |
What it Costs to Win a Customer
Winning one new paying customer costs real money before that customer generates any revenue.
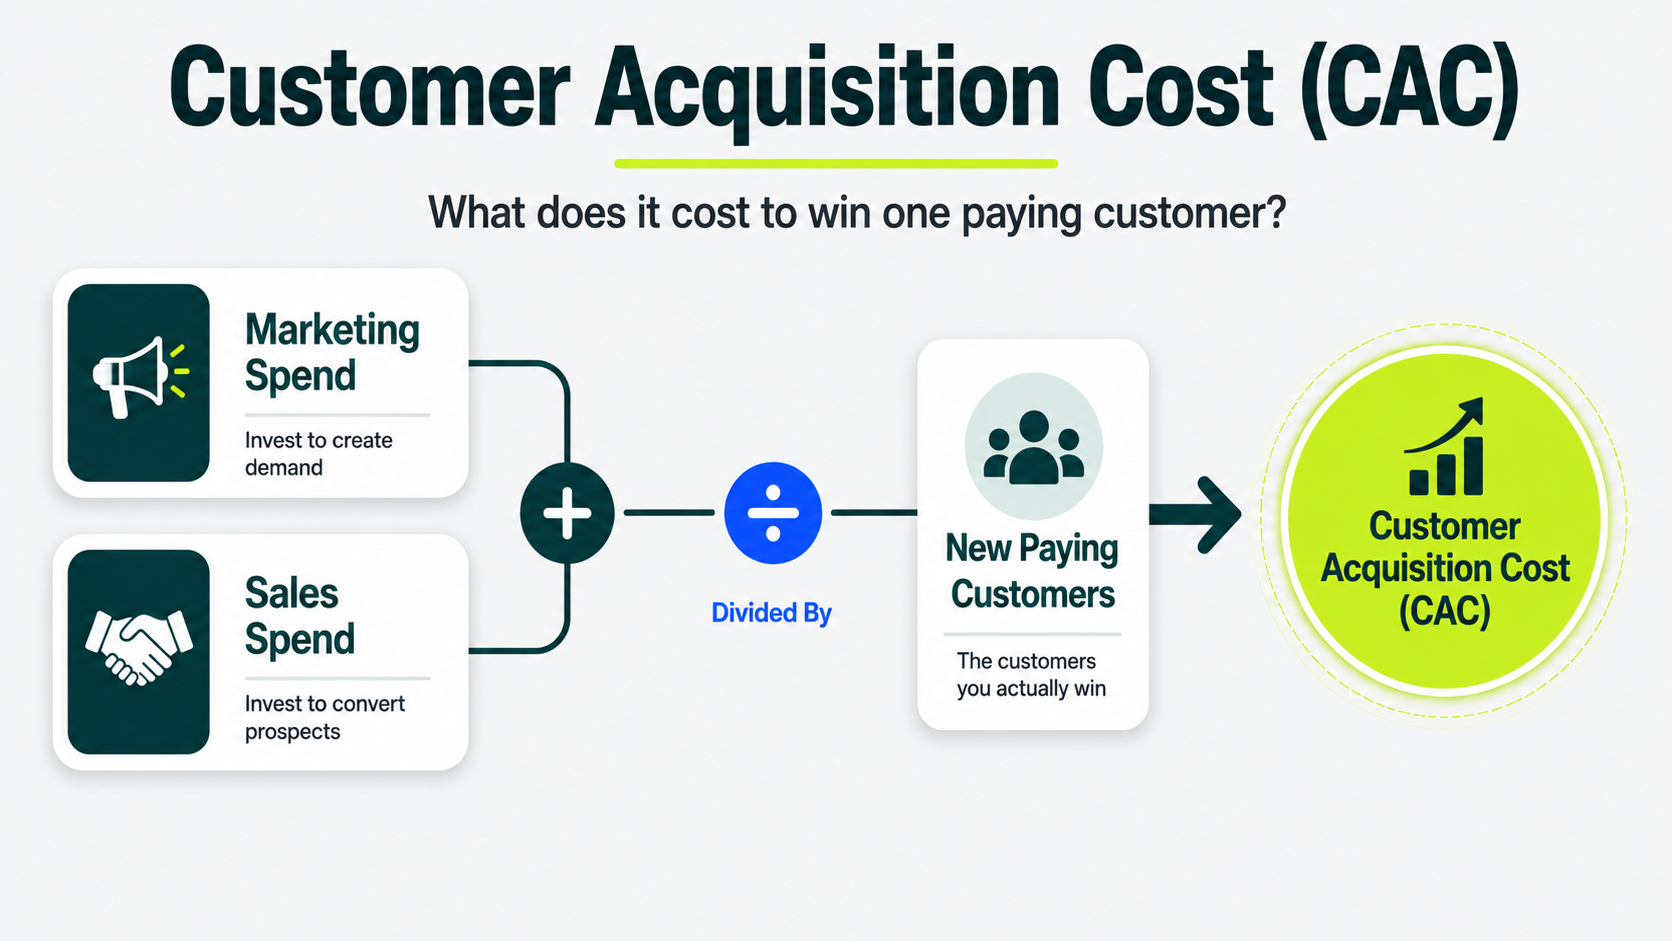
You calculate customer acquisition cost (CAC) by dividing everything you spend on marketing and sales by how many new customers you win.
Blended CAC vs. CAC by Channel
Blended CAC is the average cost of acquiring a customer across all marketing channels combined.
It’s useful for a broad presentation or high-level reporting.
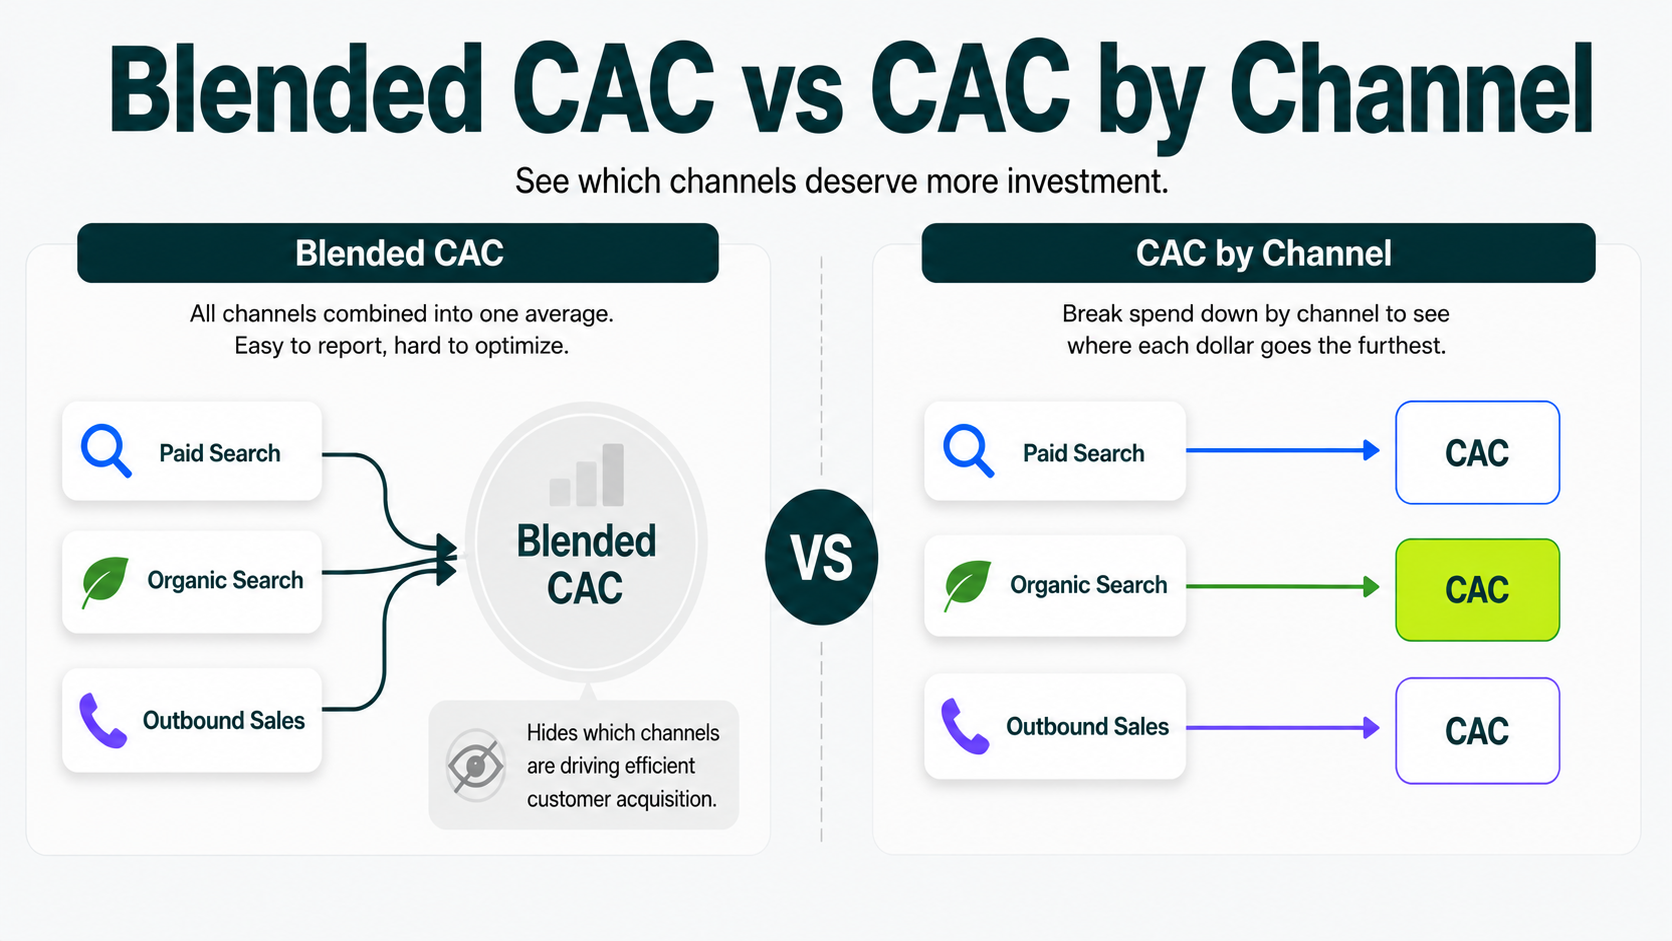
The other side is that it hides which marketing channels are actually delivering efficient customer acquisition.
CAC by channel breaks the same marketing spend down by individual acquisition source, such as:
- Paid search
- Organic search
- Outbound sales
This makes it much easier to see where each marketing dollar goes the furthest.
For seed-stage SaaS companies, CAC by channel is often more valuable than a blended CAC figure.
With a relatively small customer base, it’s much easier to trace each customer back to the channel that acquired them.
That visibility helps you identify which channels deserve more investment, which need improvement, and which should scale back.
CAC Payback Period
CAC payback period is the number of months of revenue from a new customer it takes to earn back what you spent to win them.
It’s the same math as counting the paychecks it takes to earn back a new hire’s signing bonus.
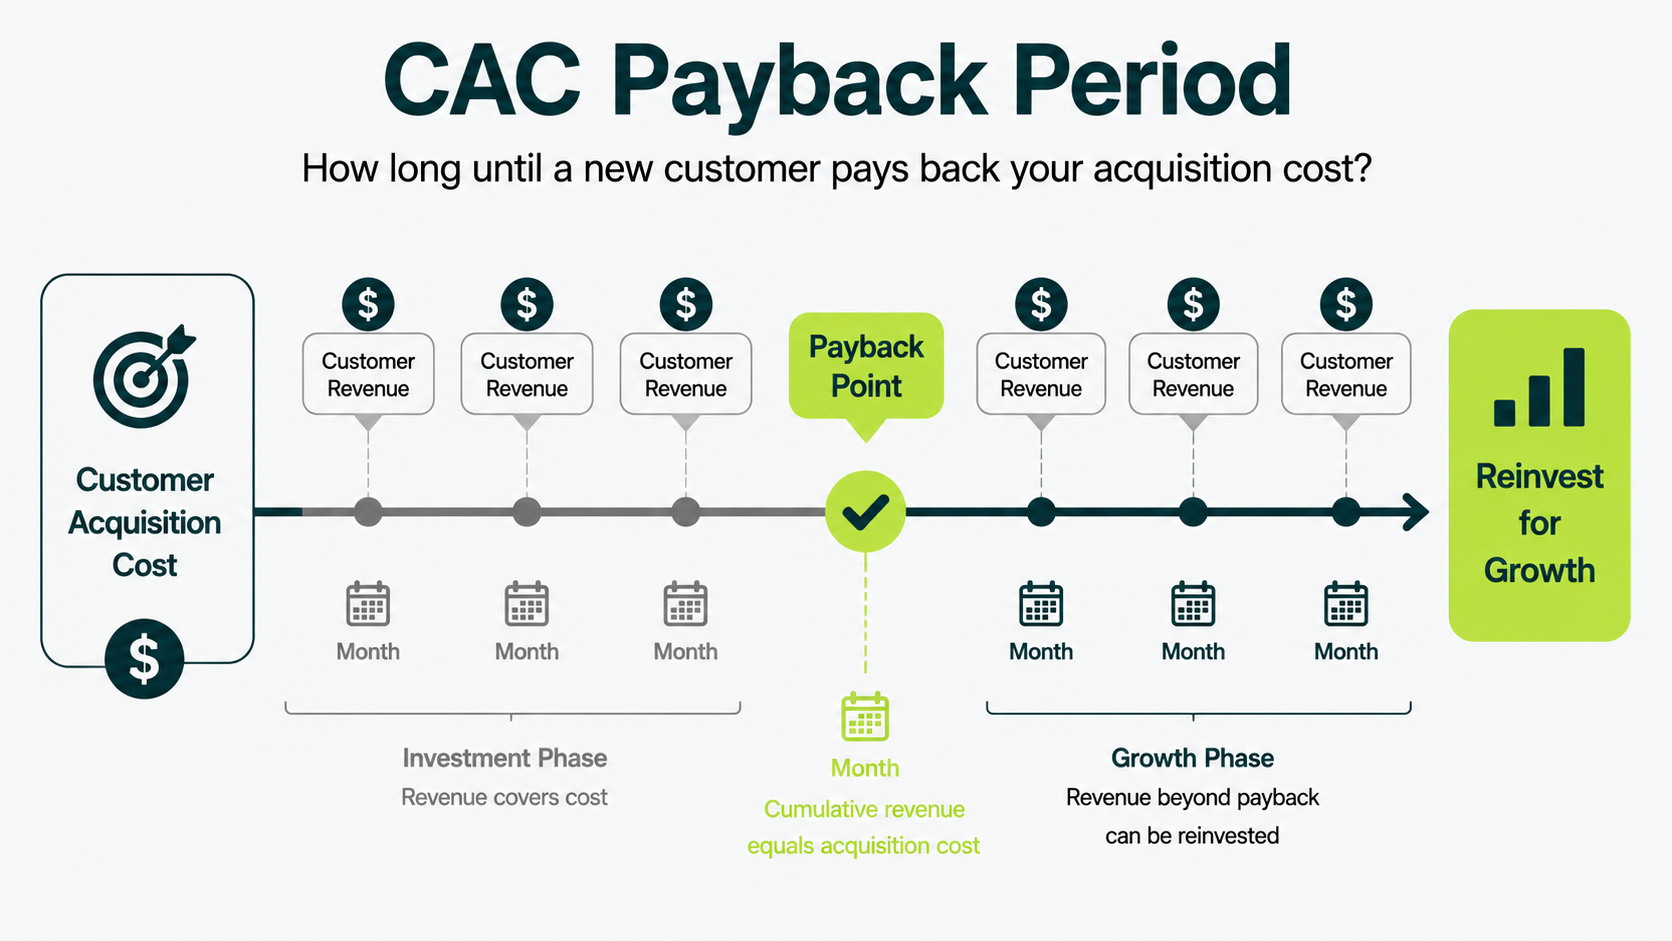
A shorter payback period means you can reinvest sooner. A longer one means your last raise quietly funds your growth rather than your own revenue.
The number moves a lot by industry, deal size, and go-to-market motion, so a single published median won’t tell you much on its own.
How Many Signups Turn Into Customers?
Trial-to-paid conversion is the share of people who try your product and then pay for it.
Free trial vs freemium is where to start, since the two motions convert at very different rates and for different reasons.
Free Trial vs. Freemium vs. Sales-Assisted
A free trial gives complete access for a set number of days, like a library loan with a due date.
Freemium keeps a basic version free forever and charges for the parts serious users need. It’s closer to a mobile game that’s free to open but requires in-app purchases to progress.
Sales-assisted motions add a person to the process, usually once someone’s product usage signals they’re ready to buy. Most teams call that a product-qualified lead.
The table below shows the motion, how it works, and what “converted” means for each.
| MOTION |
HOW IT WORKS |
WHAT “CONVERTED” MEANS |
|---|---|---|
| Free Trial |
Complete access for a set number of days. | The trial user becomes a paying customer before or at the deadline. |
| Freemium |
Free forever at a basic tier. | A free user upgrades to a paid tier, often much later. |
| Sales-assisted |
A rep steps in when the lead is ready to buy. | A qualified account signs a contract, usually with a longer cycle. |
Published conversion rates for each motion vary widely, depending on who ran the study and how they defined “converted.”
Compare your own number against the motion you actually run, rather than a blended industry figure that mixes all three together.
Keeping Customers Beats Winning Them
At the seed stage, retention benchmarks deserve more attention than acquisition benchmarks.
You can always spend more to win another customer. You can’t spend your way out of a product customers quietly stop using.
Net Revenue Retention
Net revenue retention (NRR) is the clearest single number for whether a SaaS business is actually healthy.
It’s the percentage of revenue you kept and grew from existing customers over a year, without counting any new customers.
SaaS Capital’s annual benchmarking survey puts median NRR at 103% among bootstrapped SaaS companies, with the top 10% clearing 117.9%.
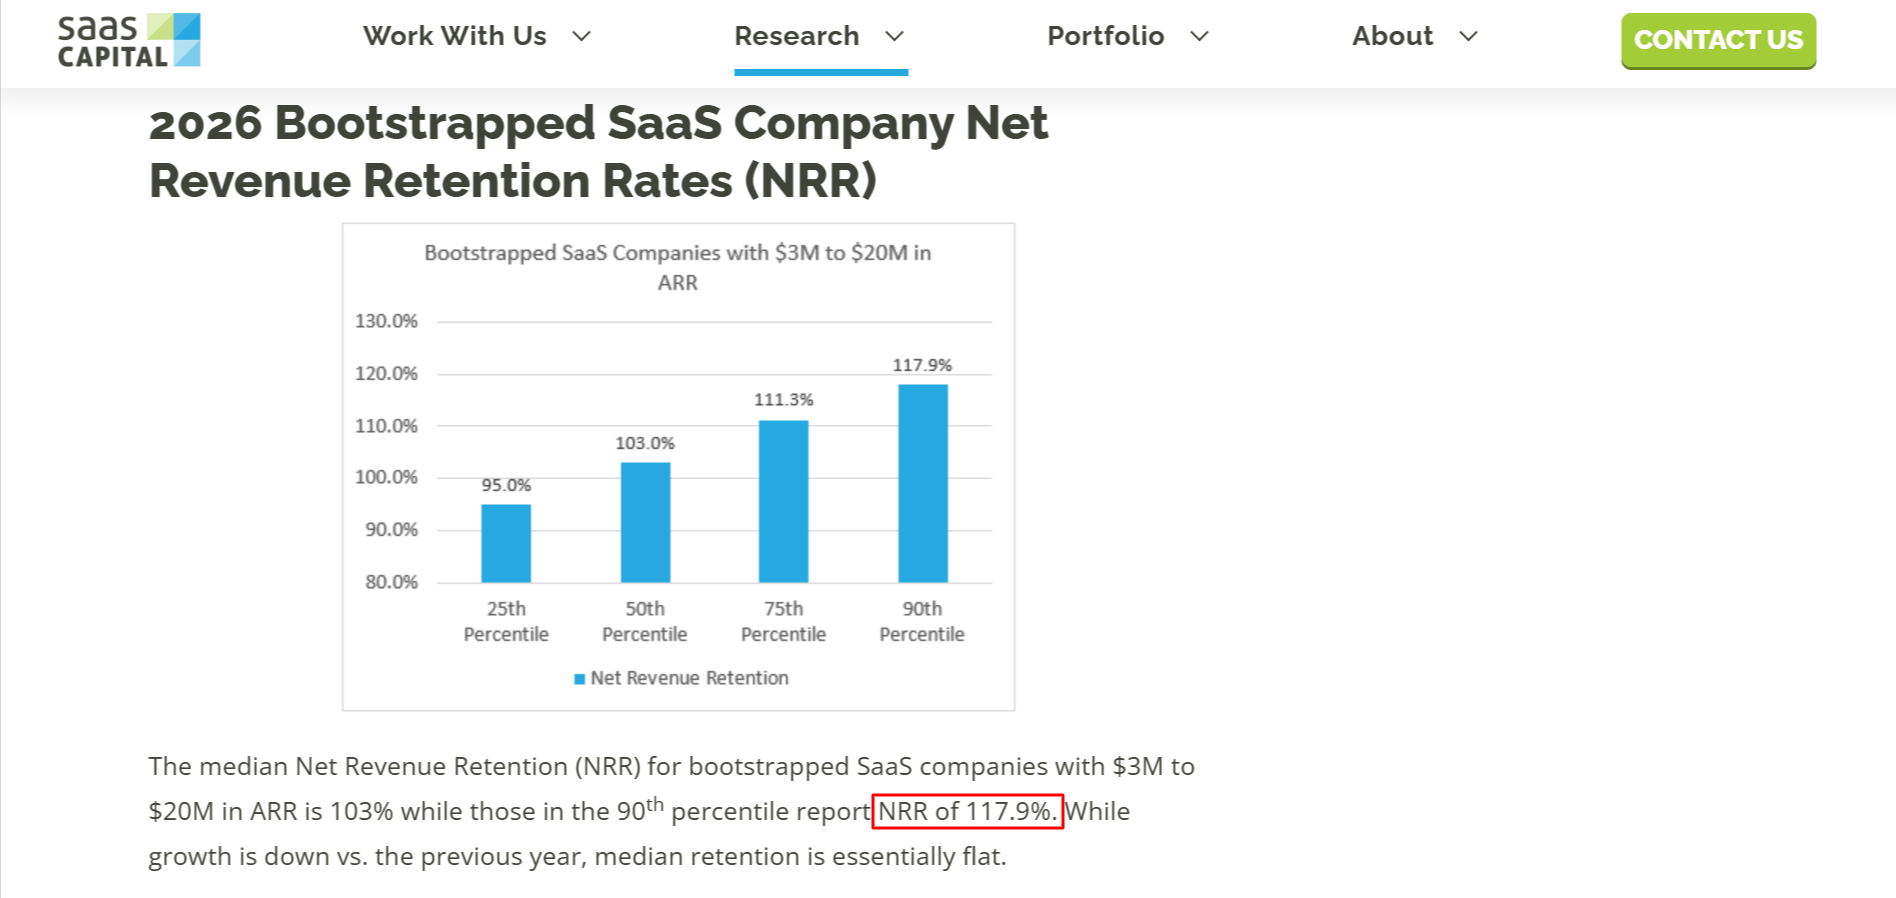
If you raised venture money instead, use the 103% figure as a reference point rather than a floor. Funding model, company size, ACV, and growth strategy can all influence retention, so compare your NRR with businesses that look more like yours.
A number over 100% means existing customers are spending more than they were a year ago, upgrades and expansions outrunning cancellations.
Gross Revenue Retention and Churn
Gross revenue retention only counts what you kept, with no credit for upgrades or expansions.
It’s the harder, more honest twin of net revenue retention.
Churn is the flip side: the share of customers or revenue you lost over a period. What counts as healthy churn depends on your price point and who you sell to. Treat any number you read elsewhere as directional.
Where the Pipeline Actually Comes From
Organic search and content marketing are where most B2B SaaS pipeline actually originates, and they’re also the channels with the least visible cost.
That second part is what organic ROI statistics rarely account for: the time and headcount required to achieve those returns.
Why Authority Alone Doesn’t Guarantee Organic Traffic
A high Domain Rating (the 0 to 100 score from Ahrefs that estimates how strong a site’s backlink profile is) doesn’t automatically mean high organic traffic.
Ahrefs’ organic traffic benchmarks from real sites found that sites with 5,000 or more indexed pages see a median of 132,889 monthly organic clicks.
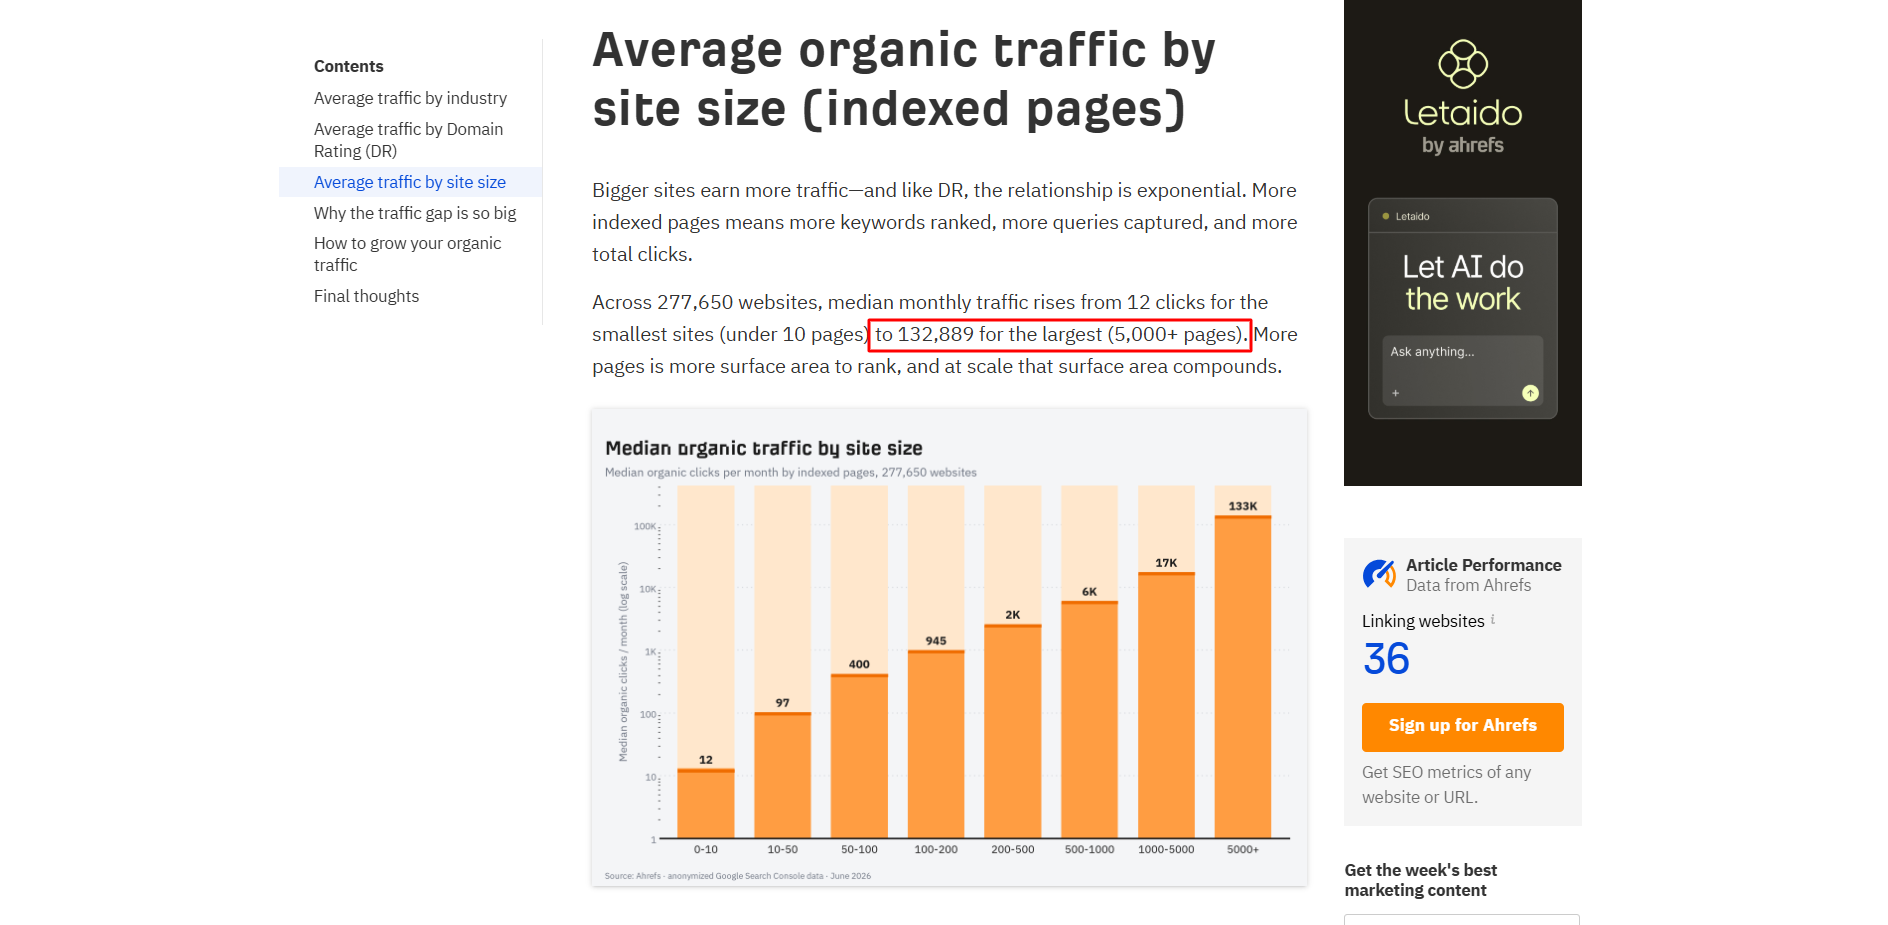
That’s higher than the 81,530 median for sites in the top Domain Rating band alone. Site size tracks with traffic almost as strongly as authority does.
That’s a different, more useful point than “raise your score and traffic follows.”
What Organic and Content Actually Cost to Earn
Organic pipeline isn’t free; you pay for it in time before you pay for it in cash.
Earning organic authority from a cold start takes a real runway before it pays back.
Across the SaaS clients we work with, we see measurable organic traction within 4 to 6 months. Meaningful pipeline contribution emerges around 6 to 9 months, depending on competition and content velocity.
Budget for that runway before you commit to organic as your primary acquisition channel.
If earning authority in SaaS is new territory for your team, that’s a separate skill from writing the content itself.
Publishing great content is only part of the process. Building the authority that content needs to rank requires its own strategy and execution.
Paid Search Still Has a Place
Paid search converts faster than organic. It also costs more per customer, almost every time. It’s the right choice when you need pipeline this quarter.
Most early-stage teams run both at once: paid for immediate pipeline, organic and content for what compounds later.
How Much of Your Budget Should Marketing Take?
There’s no single healthy revenue percentage that applies at every stage. Early on, marketing spend as a share of revenue often looks high, simply because revenue is still small.
As you grow, compare changes in the ratio with changes in revenue. This gives you a clearer view of whether your marketing spend is becoming more efficient over time.
How AI Search Changed Where Buyers Start
Buyers now ask an AI assistant before they even open a search engine. Google explicitly states that no special writing style, markup, or file format determines whether a page appears in AI answers.
Google’s own guidance on AI features states that there’s no ideal page length and that you do not need structured data or an llms.txt file.
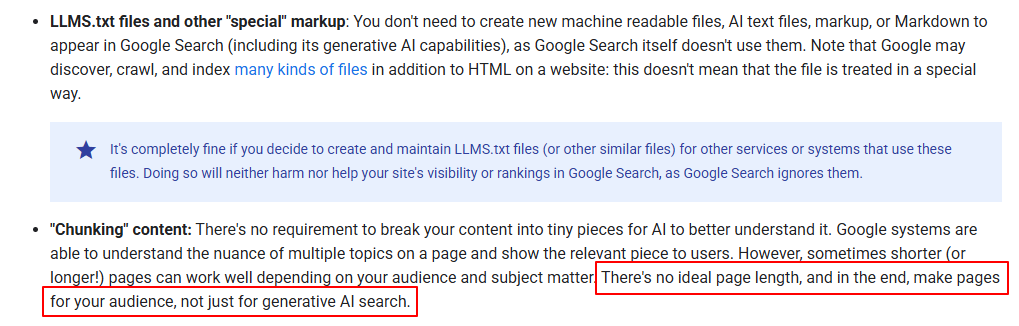
Google also says plainly that meeting every requirement and best practice still does not guarantee it will crawl, index, or serve a page. There is no formatting shortcut into AI answers.
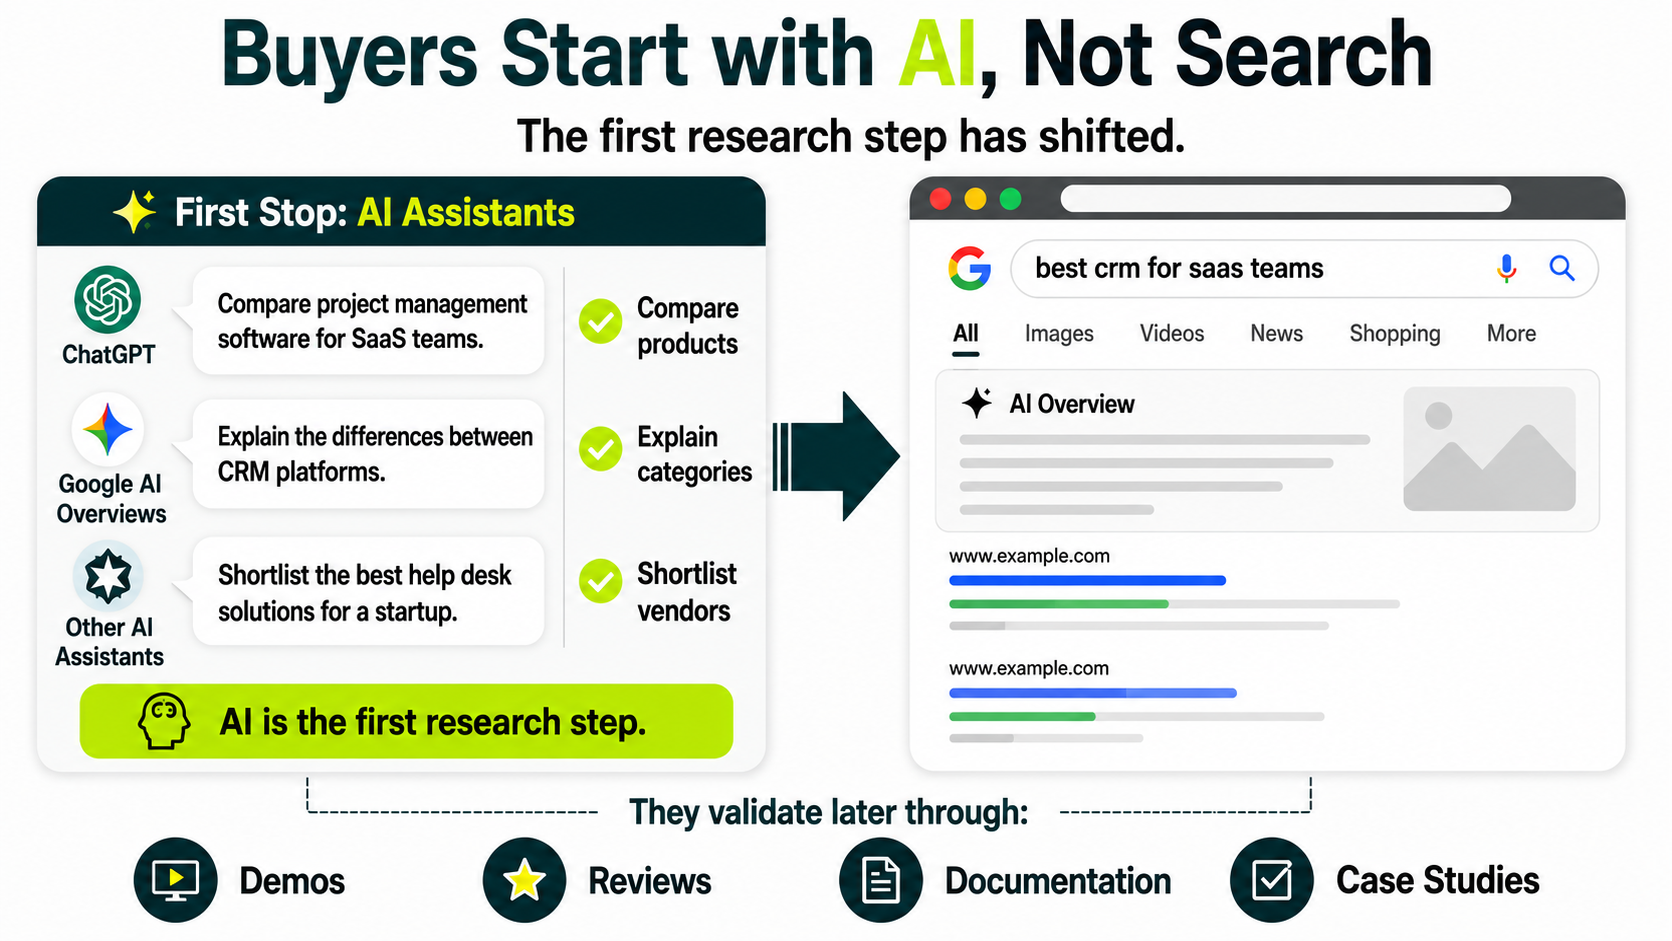
In SaaS discovery calls, we’re hearing a consistent shift in buyers’ behavior. Prospects now arrive having already asked ChatGPT, Google AI Overviews, or other AI assistants to compare products, explain categories, or shortlist vendors before visiting company websites.
They will validate their decisions through demos, reviews, and documentation, but AI has become the first research step rather than the search result page.
For the complete playbook, see how to earn visibility in AI answers.
Reading a Benchmark When You Have no Data Yet
Benchmarks only mean something once you’ve established a pattern; a single month’s performance rarely tells the complete story. Most SaaS marketers want to compare their numbers with industry benchmarks as soon as they start tracking data.
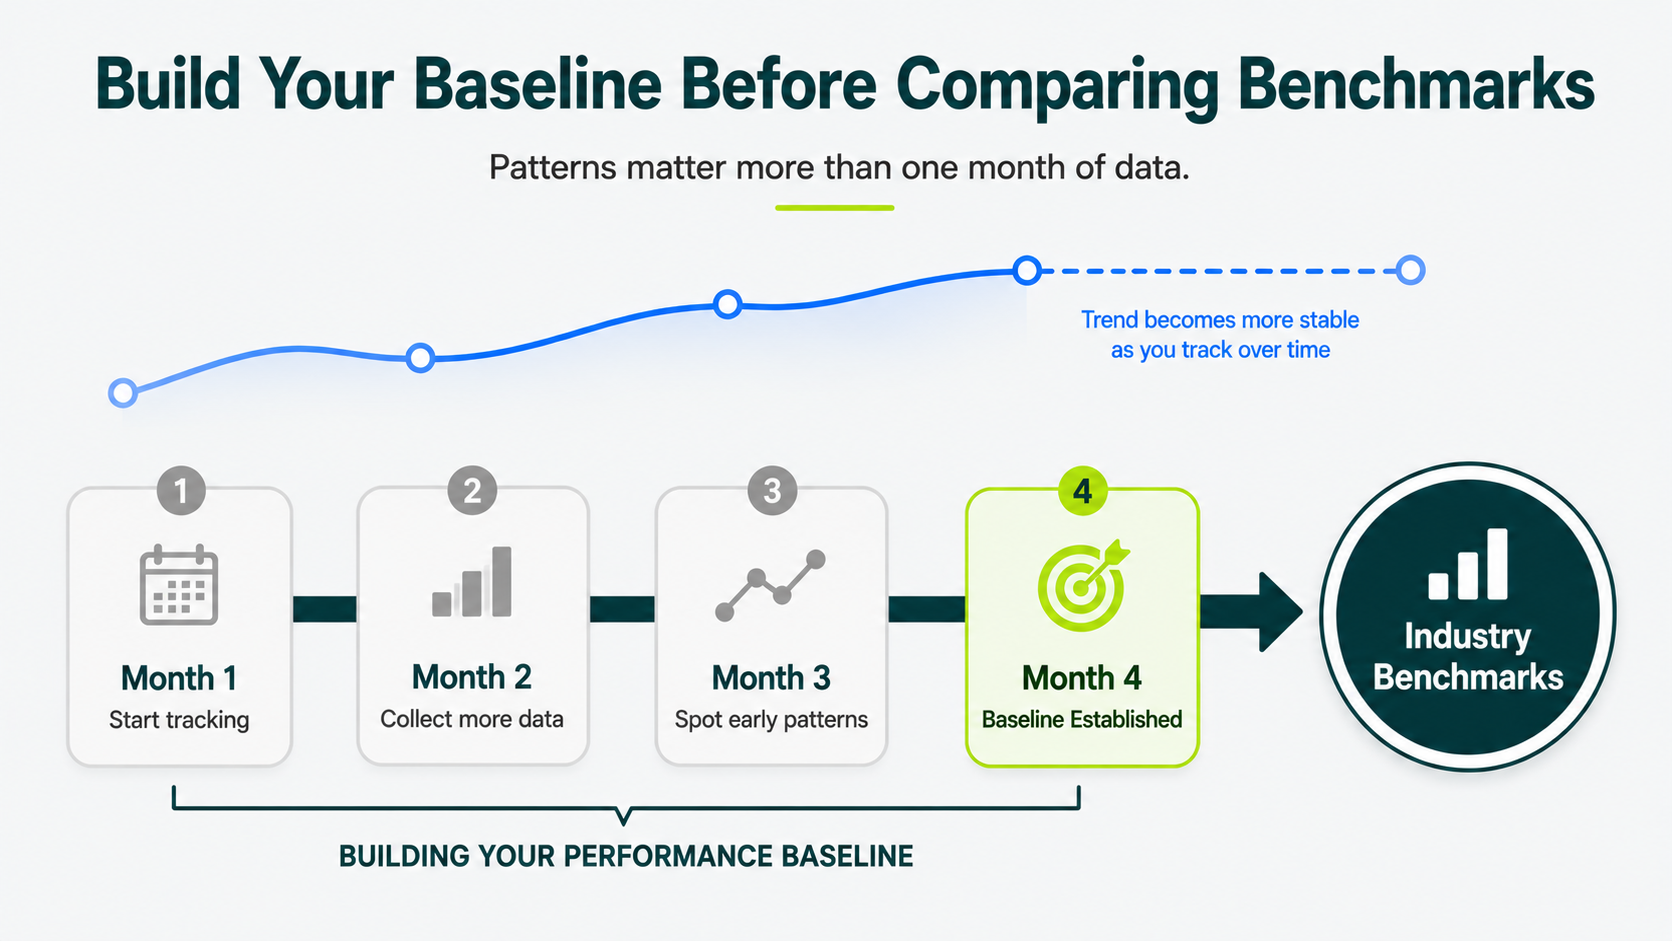
Use the first few months as a baseline rather than chasing an average.
Your First 3-Month Benchmark Journey
Don’t rush to compare your numbers. Start by creating a baseline, tracking the process, and identifying the trend.
Then use benchmarks to understand what your results actually mean.
Month 1: Build Your Baseline
You can track these three core metrics:
- Customer Acquisition Cost (CAC)
- CAC Payback Period
- Trial-to-Paid Conversion (or NRR)
Don’t worry about whether the numbers are “good.” Your goal is simply to record where you are today.
Month 2: Measure Again
Track the same three metrics using the same method.
Ask one question:
“Are the numbers moving in the right direction?”
Month 3: Look for a Trend
Now, compare all three months together.
You’ve found a trend, rather than a one-time fluctuation, once the same metric improves or declines for three straight months.
Now Compare With Benchmarks
Once you’ve established a trend, compare your metrics with SaaS businesses at a similar stage.
You can use the benchmark to ask:
- Which metric is closest to the industry average?
- Which one needs the most attention?
- What single improvement should I focus on next month?
Remember, benchmarks don’t tell you what your business should achieve. They help you understand where your business stands today, where you’re improving, and what in your business needs attention.
With that context, you’re ready to use benchmarks as a decision-making tool instead of simply comparing numbers.
Run Your Own Numbers Before You Copy a Benchmark
Every number in this article is a starting point rather than a verdict. The stage read matters more than the raw figures on their own.
If organic is the channel you’re planning to bet on, don’t commit budget to it on borrowed statistics.
Run your own numbers with the link building ROI calculator, then let your pipeline tell you what the industry median can’t.
Not sure which SaaS marketing channels deserve more of your budget?
Get a clear strategy to prioritize the channels that deliver stronger returns and support sustainable growth.
What are the most important SaaS marketing metrics to benchmark?
The most valuable SaaS marketing benchmarks include customer acquisition cost (CAC), customer lifetime value (LTV), LTV:CAC ratio, conversion rate, and free trial-to-paid conversion rate.
Loss rate, retention rate, marketing spend as a percentage of revenue, and CAC payback period are also important benchmarks to track.
Tracking these metrics helps you compare your performance with industry averages and identify areas for improvement.
How can SaaS marketing statistics improve your strategy?
SaaS marketing statistics give you reference points for evaluating acquisition costs, conversion rates, retention, and channel performance. The useful part is comparing those benchmarks with your own data to identify where growth is slowing or where additional investment makes sense.
If organic visibility is one of those areas, a SaaS link building agency can turn those insights into a plan for improving search visibility and customer acquisition.
How should SaaS companies use marketing statistics?
Use SaaS marketing statistics as benchmarks rather than fixed targets. Compare your own metrics with industry averages to identify gaps in acquisition, conversion, or retention.
Prioritize improvements where your performance falls below comparable companies. Your business model, pricing, and target market will naturally influence the numbers.
Which SaaS marketing channel delivers the highest ROI?
Organic channels such as SEO, content marketing, email marketing, referrals, and product-led growth often produce the strongest long-term returns because they continue to generate customers after the initial investment.
Paid advertising can deliver faster results but usually comes with higher acquisition costs and requires ongoing budget.
How often should SaaS marketing benchmarks be updated?
Review your internal metrics monthly and compare them with updated industry benchmarks at least once, if not twice, a year.
Marketing costs, buyer behavior, and conversion rates change over time, so relying on outdated statistics can lead to unrealistic goals and poor budget decisions.
Working with a trusted link building agency helps keep this kind of benchmarking grounded in current data rather than assumptions that were accurate a year or two ago but no longer reflect how buyers find and evaluate SaaS products today.
Why do SaaS marketing benchmarks vary so much between companies?
Benchmarks differ because SaaS companies serve different customer segments, use different pricing models, have different sales cycles, and pursue different acquisition strategies.
Enterprise SaaS businesses have higher CAC and longer payback periods than self-serve or SMB-focused products, while PLG (product-led growth) companies often prioritize activation and retention over paid acquisition.
What should you look for in a SaaS link building partner?
Ask for live placements and the reasoning behind each site, not a monthly link count. An agency that mostly serves local or ecommerce clients rarely has relationships with the publications your buyers actually read.
Pricing also varies more than most founders expect.
Our roundup of SaaS link building agencies compares them on price, placement type, and the growth stage each one fits.